Gold slips below $4,100: Fed hike fears and what the 75-minute chart shows
Gold gave back part of last week's rally as US rate hike bets grew before the CPI data. Here is the news and how to read the gold chart, step by step.
In this article
Gold is giving back part of last week's strong rally. On Monday, 10 November 2026, spot gold traded roughly between $4,060 and $4,130 an ounce, depending on the hour, as traders grew more worried that the US Federal Reserve could raise interest rates again in December. The next big test is the US inflation report (CPI) for October, which comes out this week.
Below we explain what moved gold, why rate hikes matter for a metal that pays no interest, and how the move looks on a live 75-minute chart with the Institutional Trend Catcher switched on.
What happened to gold
Last week was one of gold's best in about two months. Kotak Neo put the weekly gain at about 5%, helped by falling oil prices, which eased worries about inflation. Then the mood turned:
- Friday, 6 November: gold fell about 1% after US jobs data (the "payrolls" report) came in stronger than expected. Strong jobs numbers lifted the US dollar and bond yields, and made a Fed rate hike look more likely.
- Monday, 10 November: gold slipped again, by more than 1% at one point, after comments from Fed officials were read as "hawkish" (leaning towards higher rates). Traders are waiting for the US CPI data before taking big new positions.
- Oil: crude prices fell to around a three-month low. Cheaper oil usually means less inflation pressure, which on its own would help gold, but this week the rate story is louder.
Details are still coming out, and the CPI report can change the picture quickly in either direction.
Why rate hikes weigh on gold
Gold does not pay interest or dividends. When interest rates rise, holding cash or US government bonds pays more, so the "cost" of holding gold instead goes up. Higher US rates also tend to make the dollar stronger, and gold is priced in dollars, so it becomes more expensive for buyers using rupees, euros or yen.
That is why gold traders watch three things very closely:
- US jobs data, which shows how hot the economy is.
- US inflation (CPI), which shows whether prices are still rising too fast.
- What Fed officials say, because their words move expectations for the next meeting.
For Indian readers, the price you see at your jeweller or on MCX follows global gold plus the rupee-dollar rate, and Indian taxes and duties on top. A weaker rupee can keep local gold prices firm even on days when global gold falls.
The chart: gold on a 75-minute timeframe
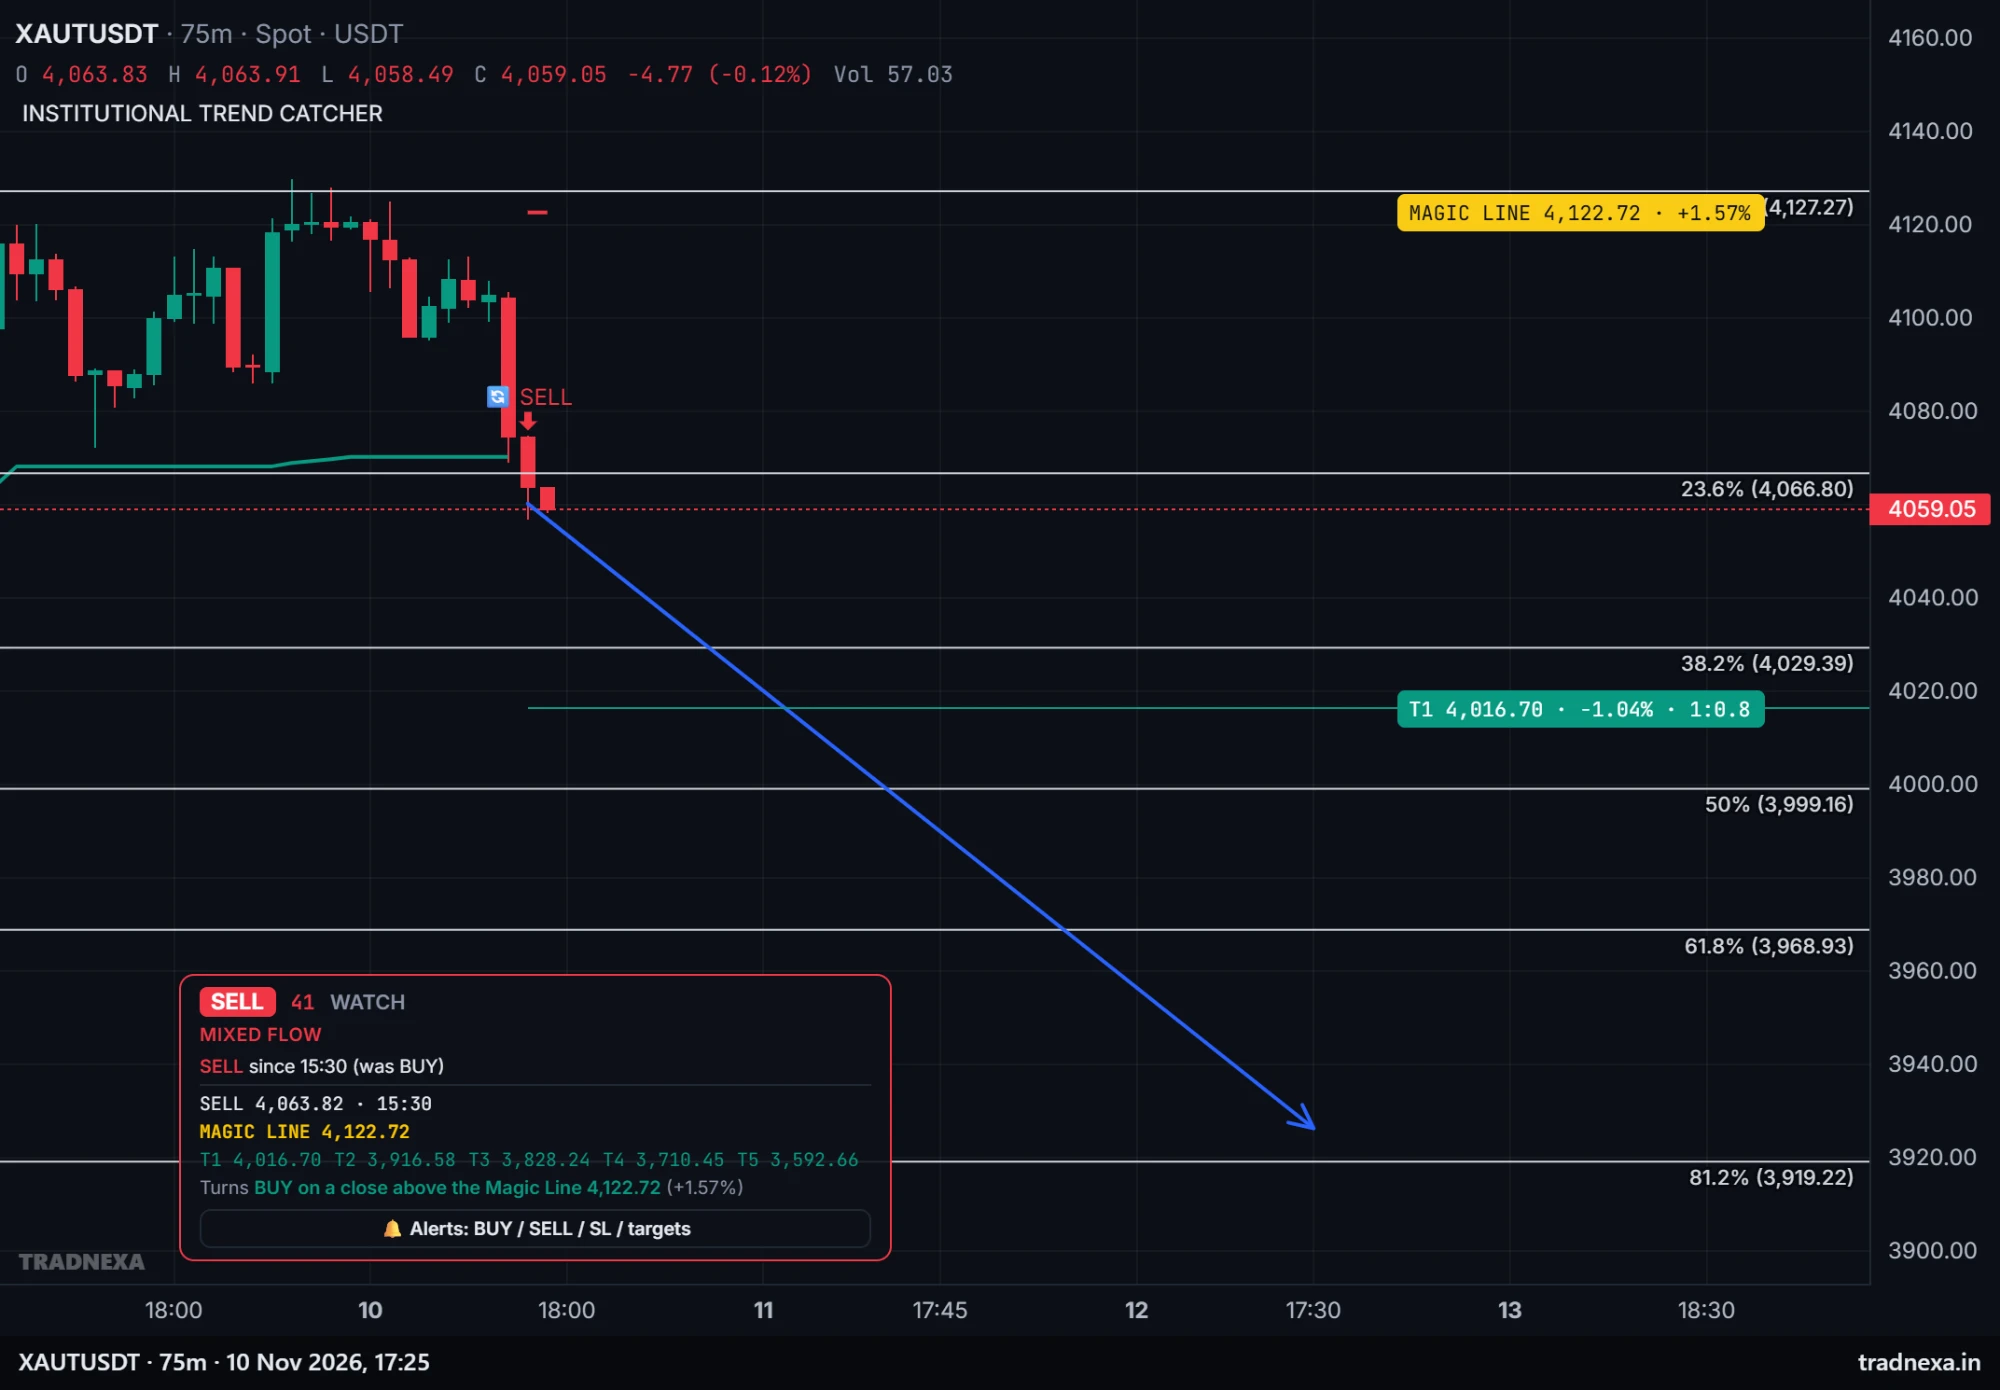
The chart above is XAUTUSDT, Tether Gold priced in USDT, on a 75-minute timeframe, at 17:25 IST on 10 November. Tether Gold is a crypto token that Tether says is backed by one troy ounce of physical gold per token, so it moves very closely with spot gold and trades around the clock. Each candle shows 75 minutes of trading.
Here is how to read each part of it.
The Magic Line
The Magic Line is the line from the Institutional Trend Catcher. It is built from the ATR (Average True Range, a measure of how much the price usually moves) with the crypto settings, ATR 18 × 4. The rule is simple:
- A candle closes above the line: the trend reads BUY and the line turns green, below the price.
- A candle closes below the line: the trend reads SELL and the line turns red, above the price.
On this chart the green line held under the price for most of 9 and 10 November. Then a long red candle closed below it, and the trend flipped. The box at the bottom says SELL since 15:30 (was BUY), with the flip candle's close of 4,063.82. The Magic Line has now jumped above the price to 4,122.72, about 1.57% higher. That line is where the reading would turn back: a close above it would flip the trend to BUY again.
The target lines
The Trend Catcher also measures distances from the flip in multiples of the risk (the gap between the flip price and the Magic Line). For crypto these are 0.8, 2.5, 4, 6 and 8 times that gap, labelled T1 to T5. Only the next one is drawn on the chart: T1 is 4,016.70, about 1.04% below the current price, marked "1:0.8". The other four are listed in the box (T2 3,916.58 down to T5 3,592.66).
These are measuring points on the chart, not predictions. Price can reverse long before reaching any of them.
Fibonacci retracement levels
The white horizontal lines come from a Fibonacci retracement drawn over the recent swing. Traders use these ratios to see where a pullback has often paused before:
| Level | Price |
|---|---|
| 23.6% | 4,066.80 |
| 38.2% | 4,029.39 |
| 50% | 3,999.16 |
| 61.8% | 3,968.93 |
| 81.2% | 3,919.22 |
Notice that the price (4,059.05 at the time) has just slipped below the 23.6% level, and that the 50% level sits right on the round number of $4,000. Round numbers often attract attention, so that area is one many chart watchers will be looking at.
The blue arrow
The blue arrow is a hand-drawn line, not part of any indicator. It is one way of picturing a path if the move continued, and it is only a drawing. Charts show what has happened; they cannot tell us what will happen.
Flow and score
The top of the box shows a score of 41 with "WATCH" and "MIXED FLOW". In plain words: the trend has turned, but the buying and selling pressure behind it is not one-sided yet. Mixed flow is a reminder that a fresh flip can still be shaken out.
What to watch this week
- US CPI (October): a hotter number would add to rate hike bets; a cooler one could ease them. Gold often moves sharply in the minutes after the release.
- Fed speakers: any change in tone about December.
- The dollar and US bond yields: these usually move opposite to gold.
- Oil: a fresh rise in crude could bring inflation worries back.
- On the chart: whether candles keep closing below the Magic Line, how price behaves around the 38.2% level and the $4,000 area, and whether a close above the Magic Line flips the trend back.
You can open the same market and add the Institutional Trend Catcher on our free live charts. If you are new to reading put and call data for Indian indices, our PCR explainer covers the basics, and our post on oil, war risk and markets explains why crude matters for inflation.
Whatever you trade, decide in advance how much you are willing to lose, size small around big data releases like CPI, and remember that gaps and spikes can jump past any line on a chart.
FAQ
Why is gold falling today?
Gold slipped because traders now see a higher chance of a US interest rate hike in December, after strong US jobs data and hawkish comments from Fed officials. Higher rates make gold, which pays no interest, less attractive and tend to lift the dollar.
What is XAUTUSDT?
XAUTUSDT is Tether Gold (XAUt) priced in the USDT stablecoin. Tether says each token is backed by one troy ounce of physical gold, so its price follows spot gold closely, and it trades 24 hours a day, including weekends.
What does the Magic Line show on a gold chart?
The Magic Line is the Institutional Trend Catcher's ATR line. A close above it reads BUY and a close below it reads SELL. On 10 November the 75-minute gold chart closed below it, so the reading flipped from BUY to SELL, with the line now above the price.
Is the $4,000 level important for gold?
It is a round number, and on this chart it also sits close to the 50% Fibonacci retracement. Levels like this often draw attention from traders, but no level is certain to hold or break.
Does the US CPI report affect gold prices in India?
Yes. Indian gold prices follow global gold and the rupee-dollar rate. If the CPI data moves global gold or the dollar, prices on MCX and at jewellers usually follow, along with the effect of the rupee.
Sources
- CNBC: Gold drops 1% as strong U.S. payrolls boost dollar, yields (6 Nov 2026)
- FXStreet: Gold falls over 1% as hawkish Fed remarks weigh ahead of US CPI (10 Nov 2026)
- FXStreet: Gold declines below $4,150 as rising Fed hike expectations outweigh US-Iran deal hopes (10 Nov 2026)
- Kotak Neo: Gold price holds near $4,120 after 5% weekly rally, Fed rate risks in focus (10 Nov 2026)
- Goodreturns: Gold and silver rates today, spot gold falls near $4,115, oil at 3-month low (10 Nov 2026)
- GuruFocus: Gold prices dip as investors await U.S. CPI data (10 Nov 2026)
- Kitco: Gold price today (10 Nov 2026)
- Tether: Tether Gold (XAUt)
For education only. Not investment advice. Tradnexa is not a SEBI-registered investment adviser or research analyst. Trading in crypto, futures and options carries a high risk of loss; past moves don't predict future ones. Read our risk disclaimer.