Bitcoin falls below $67,000 to a 3-month low: $1.6 billion liquidated, what traders should watch
Bitcoin slid under $67,000 for the first time since August as forced selling, ETF outflows and Fed hike bets hit crypto. What happened and what to watch.
In this article
Bitcoin has dropped below $67,000 for the first time in almost three months. On Friday night (13 November, US time) and into Saturday morning in India, the world's biggest cryptocurrency slid to roughly $66,600 to $66,800 on major exchanges, its weakest level since mid-August. More than $1.3 billion of leveraged crypto bets were forced shut in 24 hours, money kept leaving Bitcoin ETFs, and traders raised their bets on a US interest-rate hike in December.

What happened, in numbers
Reports from different data sites differ a little because prices move every second, but they tell the same story:
| What | Roughly |
|---|---|
| Bitcoin's low | about $66,600 to $66,800 |
| Move over the past week | down about 10% |
| Distance from the record (about $126,000, October 2025) | about 46% lower |
| Crypto positions forced shut (24 hours) | $1.3 billion to $1.6 billion, mostly bets on a rise |
| Money out of US spot Bitcoin ETFs since 30 October | more than $2.5 billion (one estimate) |
| Ethereum | near $1,900 to $1,950, down about 4% in a day |
| Crypto Fear and Greed Index | between 13 and 21: "extreme fear" |
Only two days ago Bitcoin slipped under $72,000 after Nvidia's CEO quit and US inflation came in hot, which we covered in our post on Jensen Huang and Bitcoin. The slide has kept going since.
Why Bitcoin keeps falling
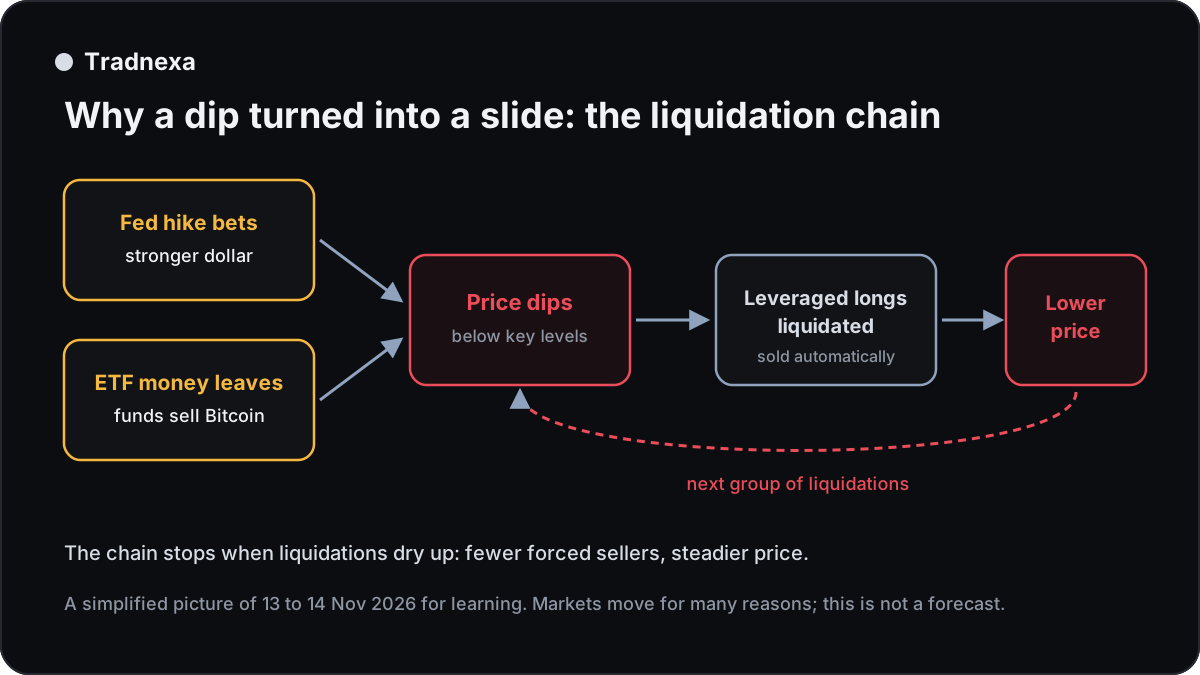
Three forces are pulling in the same direction.
1. The Fed may raise rates again
US inflation came in higher than expected this week, and more data on prices (the producer price index, or PPI) is due. Traders now see a December rate hike by the US Federal Reserve as likely. Higher interest rates make safe assets like bonds and cash more attractive, so money tends to leave risky assets such as crypto and tech shares. A stronger US dollar adds to the pressure.
2. ETF money is leaving
US spot Bitcoin ETFs are funds that hold real Bitcoin for investors. When those investors sell, the fund has to sell Bitcoin too. Billions of dollars have left these funds since the end of October, which means steady selling into a falling market.
3. Leverage turned a drop into a crash
Many crypto traders borrow money to make bigger bets. This is called leverage. If the price moves against them far enough, the exchange closes their position automatically: a liquidation. When most traders are betting on a rise, a fall triggers a chain:
- The price drops a little.
- Leveraged "long" (rise) bets hit their limit and are sold automatically.
- That forced selling pushes the price lower.
- The lower price triggers the next group of liquidations.
That is why more than a billion dollars of positions can disappear in a single day, and why the fall looks so sharp on a chart.
Extreme fear: what it usually means
The Crypto Fear and Greed Index measures the market's mood from 0 (extreme fear) to 100 (extreme greed), using price swings, volume and social media. Readings between 13 and 21 mean traders are scared.
Extreme fear does not tell you the bottom is in. It tells you most weak hands may already have sold. In past sell-offs, very low readings have sometimes come near short-term lows and sometimes just before another leg down. It is a mood gauge, not a timing signal.
Levels traders are watching
Analysts are mostly watching round numbers, because many traders place orders around them:
- $65,000: the next round number below the current price.
- $70,000 to $72,000: the area Bitcoin fell through this week. A move back above it would show buyers returning.
You can see support and resistance worked out from recent 4-hour candles on our free crypto levels page. These are areas where price reacted before, not predictions.
How it shows up on a chart
Open Bitcoin on Tradnexa charts on the 1-hour or 4-hour timeframe and a few things stand out after a day like this:
- Long red candles with high volume: the footprint of forced selling.
- Wicks below the candles: long lower wicks after a liquidation wave can mean the forced selling is drying up. They are not a promise of a turn.
- The Magic Line (Tradnexa's ATR-based trend line): while Bitcoin closes below it, the trend is bearish. A close back above it is the first sign that the trend may be changing.
What it means for Indian traders
Crypto traders in India: Bitcoin at around $67,000 is roughly ₹57 lakh at today's dollar rate. Indian traders also pay a 1% TDS on crypto sales and 30% tax on gains, so frequent trading in a volatile market costs more here than it does abroad. Leverage on crypto futures can wipe out a position quickly in moves like this one.
Stock market traders: Indian shares were already weak on Friday. The Sensex fell 319 points to 81,592 and the Nifty closed at 25,144, with banks and realty dragging, as inflation worries spread. The same global fear of higher US rates is behind both moves. The overall bias for Monday's open is cautious (neutral to bearish), but Indian shares often move on their own news, such as the RBI's own inflation fight, which we explained in our post on India's inflation crossing 6%.
What to watch next
- US producer prices (PPI) and any comments from Fed officials before the December meeting.
- Bitcoin ETF flows: a few days of inflows would suggest big holders have finished selling.
- Liquidation totals: if they fall while the price holds steady, the forced selling may be over.
- The Fear and Greed Index: a climb out of extreme fear usually comes before a lasting recovery, not after.
FAQ
Why did Bitcoin fall below $67,000?
A mix of rising bets on a US rate hike in December, a stronger dollar, money leaving US Bitcoin ETFs and more than $1.3 billion of forced liquidations of leveraged bets. Each one added selling to a market that was already weak.
What is a crypto liquidation?
When a trader borrows to make a bigger bet and the price moves too far against them, the exchange closes the position automatically. Many liquidations at once can push the price down very quickly.
Is this the lowest Bitcoin price this year?
It is the lowest since mid-August 2026, about three months. Bitcoin is still about 46% below its record of about $126,000 from October 2025.
Does Bitcoin's fall affect Nifty?
Not directly, but both react to the same global mood. When traders expect higher US interest rates, they often cut risk everywhere, from crypto to emerging-market shares like India's.
Should I buy Bitcoin now that it has fallen?
We don't give buy or sell advice. Watch how the price behaves around round numbers, the ETF flows and the liquidation totals, and decide with your own plan and only with money you can afford to lose.
Sources
- FXStreet: Bitcoin slides toward $67,568 as $1.64 billion liquidation wave hits traders on a scary Friday (13 Nov 2026)
- Crypto Times: Bitcoin price today, BTC slides to $67K as $1.26B crypto liquidations hit longs, Fed hike bets rise (14 Nov 2026)
- KuCoin News: Bitcoin falls below $68,000 as $1.29 billion in liquidations occur in 24 hours (14 Nov 2026)
- Bloomingbit: Bitcoin, altcoins slide in tandem; Bitcoin falls to $66,600 (14 Nov 2026)
- BigGo Finance: Bitcoin breaks below $67,000 to 3-month low; $2.5 billion flees ETFs (14 Nov 2026)
- CryptoTicker: Bitcoin price at lowest since August, levels to watch (14 Nov 2026)
- CoinGlass: Bitcoin price today (14 Nov 2026)
- KuCoin News: Ethereum drops 4.4% in 24 hours as the Crypto Fear and Greed Index reaches 21 (14 Nov 2026)
- CoinGabbar: Crypto news Nov 14 covers Bitcoin, PPI data, Fed hike odds and more (14 Nov 2026)
- Business Standard: Sensex snaps 3-day winning run, ends 319 pts lower; Nifty at 25,144 (13 Nov 2026)
For education only. Not investment advice. Tradnexa is not a SEBI-registered investment adviser or research analyst. Trading in crypto, futures and options carries a high risk of loss; past moves don't predict future ones. Read our risk disclaimer.