Nifty and Bank Nifty print a red candle at the top: reversal or just a pullback?
Nifty and Bank Nifty ran up after the Diwali break, then sold off from the highs. What a red candle at the top means, and how to read it with Fibonacci.
In this article
After a huge run, Nifty and Bank Nifty did something today that makes every trader nervous: they opened strong, climbed early, and then gave back a big part of the move. On the daily chart that leaves a red candle sitting right at the top of the rally.
So is this the start of a reversal, or just a healthy pause before the next leg? Nobody can know for sure from one candle. But there is a clear way to think about it, and that is what this post is about.
What happened today
Indian markets reopened on Wednesday, 11 November, after the Diwali Balipratipada holiday. GIFT Nifty had been pointing to a higher start, helped by cheaper crude oil.
- Early strength: the indices rallied in the first half of the day. Bank Nifty was up around 1.5% to 2% at different points of the day, led by banking shares.
- Selling from the highs: later in the session, IT and pharma shares slipped, and the indices pared a large part of their gains, as Business Standard's live coverage reported.
- The result on the chart: both indices finished below where they opened, even though they were still higher than Monday's close for most of the day.
This all comes after the strongest week for Nifty and Sensex since February 2021, when the indices rose around 9% in five sessions. So the red candle is appearing after a very sharp move up.
A red candle does not always mean a down day
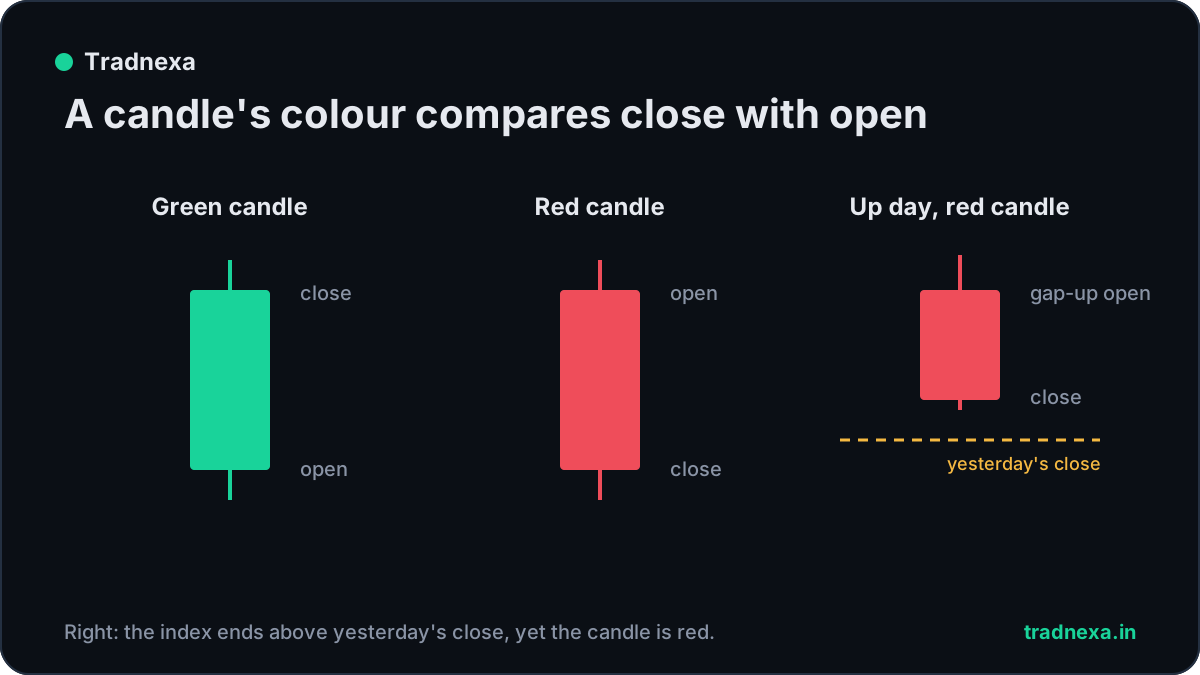
This confuses many new traders. A candle's colour compares the close with the open of the same day, not with yesterday's close.
- Green candle: the price closed above where it opened.
- Red candle: the price closed below where it opened.
So a day can be "up" on the news ticker and still print a red candle on the chart. That is exactly what a gap-up open followed by selling looks like. The important message of today's candle is: buyers pushed the price up early, and sellers took control later in the day.
Reversal or pullback? The checklist
One candle is a warning, not a verdict. Here is how many chart readers separate the two.
Signs it is just a pullback (the bullish bias stays):
- The next one or two days do not close below the low of today's red candle.
- Selling volume is lighter than the buying volume of the rally days.
- Bank Nifty, the leader of the rally, keeps holding up better than the rest.
- Foreign investors keep buying (they were a big reason for last week's rally).
Signs it could be turning into a reversal (the bias weakens):
- A close below the red candle's low in the next sessions, ideally with rising volume.
- More red candles in a row, each making a lower high.
- Leadership fading: banks stop rising while IT and other heavyweights keep falling.
- The Put-Call Ratio (PCR) dropping sharply, which shows option traders turning more defensive.
Our read of the evidence today: after a 9% week, a red candle at the top looks more like a pause than a proven reversal, but the next one or two closes matter much more than today's.
How Fibonacci helps read a pullback
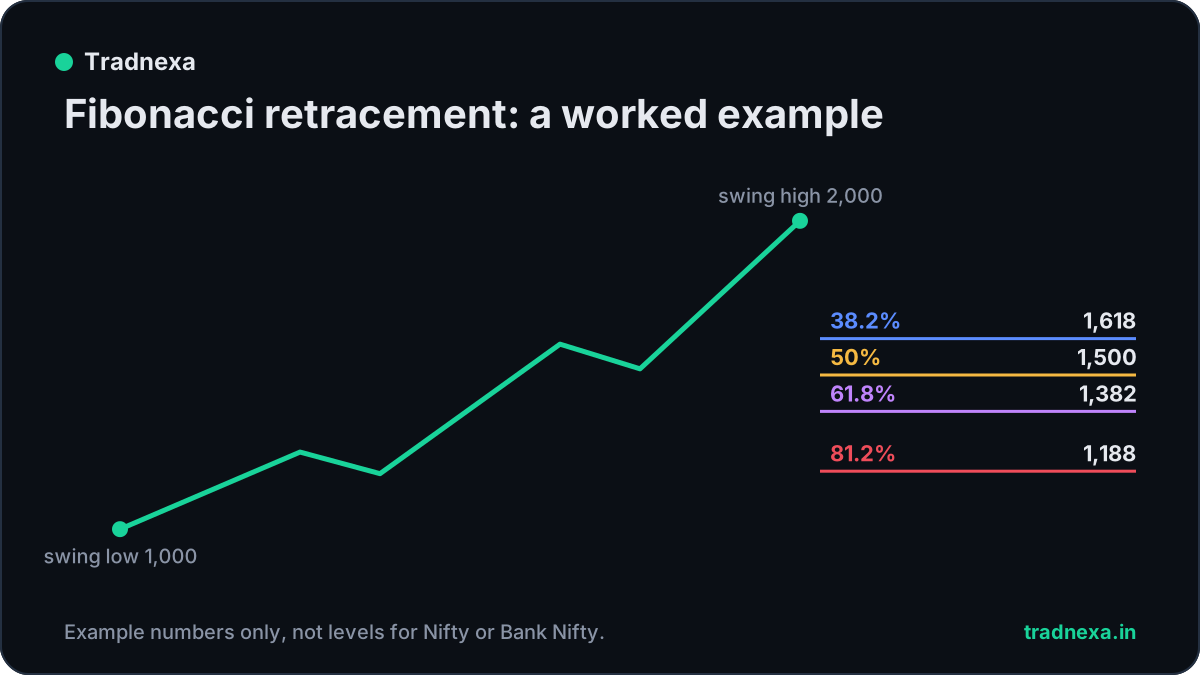
When a strong rally pauses, many traders use Fibonacci retracement to judge how deep the pullback is. You draw it from the swing low (where the rally started) to the swing high (the top), and the tool marks how much of that move the price has given back.
The common levels are:
- 38.2%: a shallow pullback. Strong trends often pause here.
- 50%: a halfway pullback. Not a true Fibonacci ratio, but widely watched.
- 61.8%: the "golden ratio". A deeper pullback that many treat as the last line for the trend.
- 81.2%: a very deep pullback. Beyond this, the rally is mostly undone.
A worked example (illustrative numbers only)
Imagine a made-up index that rallies from a swing low of 1,000 to a swing high of 2,000. The move is 1,000 points. The retracement levels would be:
| Level | Points given back | Example level |
|---|---|---|
| 38.2% | 382 | 1,618 |
| 50% | 500 | 1,500 |
| 61.8% | 618 | 1,382 |
| 81.2% | 812 | 1,188 |
These are example numbers to show the maths, not levels for Nifty or Bank Nifty.
How traders usually read them:
- A pullback that stops around 38.2% to 50% keeps the trend looking healthy.
- A move through 61.8% is often read as a sign that the rally is weakening.
- A fall past 81.2% means most of the rally has been erased.
Draw it yourself on Tradnexa
You can draw the same tool on the live Nifty or Bank Nifty chart in under a minute on our free charts:
- Open the chart and choose a daily or 75-minute timeframe.
- Pick Fibonacci retracement from the drawing tools on the left.
- Click the swing low where the rally began, then the swing high at the top.
- The levels appear by themselves. You can change colours and which levels show in the settings.
The Institutional Trend Catcher on the same chart shows the Bullish or Bearish bias with the Magic Line, so you can see whether the bigger trend has actually turned.
What to watch in the next sessions
- The low of today's red candle: a close below it would be the first real sign of weakness.
- Bank Nifty's strength: banks led the rally; watch whether they keep leading.
- IT and pharma: they dragged today. Continued selling there could weigh on Nifty.
- NIFTY and BANK NIFTY PCR: you can see both free on Institutional NexaScan. Our post on reading the PCR explains what the numbers mean.
- Global cues: US inflation came in hot this week, and GIFT Nifty will show early how overseas markets react.
After a sharp rally, pullbacks are normal and even healthy. Whatever you trade, decide your risk before you enter, keep position sizes sensible, and avoid chasing the first big candle in either direction.
FAQ
What does a red candle at the top of a rally mean?
It means the price closed below where it opened after a strong move up. Buyers were in control early, and sellers took over later in the day. It is a warning sign, but one candle alone does not confirm a reversal.
Can the market be up for the day and still show a red candle?
Yes. A candle's colour compares the day's close with the day's open, not with the previous close. If the index opens with a gap up and then slides, it can finish higher than yesterday but still print a red candle.
How do I know if it is a reversal or a pullback?
Watch the next one or two closes. A close below the red candle's low, with rising volume and more lower highs, points towards a reversal. Holding above that low, with light selling, points towards a pullback within the trend.
Which Fibonacci levels do traders watch in a pullback?
The most watched retracement levels are 38.2%, 50% and 61.8%, with some traders also using a deeper level such as 81.2%. They are drawn from the swing low to the swing high of the move.
Can I draw Fibonacci levels on Nifty for free?
Yes. Tradnexa's free live charts include a Fibonacci retracement tool. Open the Nifty or Bank Nifty chart, pick the tool, and click the swing low and the swing high to see the levels.
Sources
- Business Standard: Stock Market LIVE, Sensex gains 397 pts, Nifty at 25,130 in closing auction session (11 Nov 2026)
- Business Standard: Bullish signals! GIFT Nifty jumps 1% as crude oil prices test $90/bbl (10 Nov 2026)
- NiftyTrader: GIFT Nifty gains high hopes for Wednesday as oil cools after Diwali break
- Dhan: NIFTY BANK share price today (11 Nov 2026)
- Kotak Neo: Nifty Bank index share price today (11 Nov 2026)
- Upstox: Market weekly wrap, SENSEX jumps 6,568 pts, NIFTY50 rallies 9% as FIIs return
- Zee Business: Sensex, Nifty surge 9% in best weekly rally since Feb 2021
For education only. Not investment advice. Tradnexa is not a SEBI-registered investment adviser or research analyst. Trading in crypto, futures and options carries a high risk of loss; past moves don't predict future ones. Read our risk disclaimer.