Can Bitcoin cross $1 lakh ($100,000) again? What it would take from $65,000
Bitcoin is near $65,000, about 48% below its record. Here is what a return to $100,000 would need: the levels, the money flows and history.
In this article
Bitcoin is trading close to $65,000 on 17 November 2026, after a sharp week that took it down to about $62,000 on Saturday, its weakest level since July. That puts the world's biggest cryptocurrency around 48% below its record of roughly $126,000 set in October 2025, and about 35% below the famous $1 lakh mark ($100,000). So the question every crypto group is asking: can Bitcoin get back above $100,000?

The short answer: it is possible, it has happened before from almost exactly this price, but it would need several things to turn at once. Here is the full picture in plain words.
Where Bitcoin stands today
- Price: about $64,500 to $65,500 through Monday and Tuesday.
- Last week: down about 14%, one of its worst weeks of 2026, according to Crypto.news and Bitcoin.com.
- The low: about $62,000 on 15 November.
- Early November: Bitcoin bounced to around $78,000 to $81,000 after the US midterm elections (CoinDesk), then gave all of it back.
- Last time above $100,000: November 2025. Bitcoin has stayed below $100,000 for the whole of 2026 so far, as Cointelegraph and Bitcoin.com both note.
In Indian terms, $100,000 is roughly ₹85 lakh per Bitcoin at today's exchange rate, which is why traders here call it the "1 lakh dollar" level.
The maths: how far is $100,000?
From $65,000, Bitcoin needs to rise about 54% to reach $100,000. That sounds huge, but Bitcoin moves far more than shares do. The chart below shows the levels traders are watching on the way and how far each one is from today.
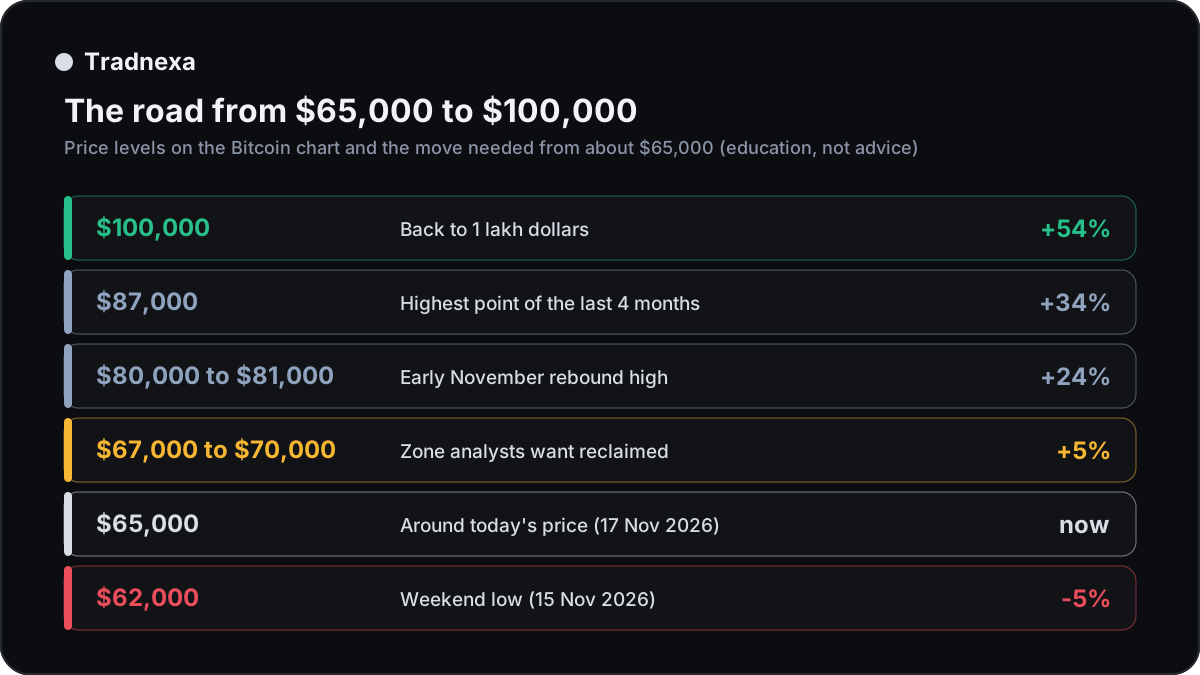
- $62,000 (below): the weekend low. Analysts quoted by Cryptonews call the $60,000 area "the line in the sand".
- $67,000 to $70,000: the first zone analysts say Bitcoin needs to win back to show the fall is over.
- $78,000 to $81,000: where the early-November bounce stopped.
- About $87,000: the highest price of the last four months.
- $100,000: the round number that matters most for headlines and for sentiment.
Each of these is a place where sellers stepped in before. Price usually has to climb them one at a time, and each one is a chance for the move to stall.
It has happened before, from almost this exact price
This is the part that makes the question exciting. In October 2024, Bitcoin was trading between about $65,000 and $69,000, very close to today. By the first week of December 2024, it crossed $100,000 for the first time. That was roughly a 50% rise in about seven weeks.
It happened again on a smaller scale in 2025: after falling to around $74,000 in April 2025, Bitcoin climbed back above $100,000 within about four weeks.
But both times, there was a strong push behind the move: a US election result the crypto market liked in 2024, and fresh buying by large funds through spot Bitcoin ETFs (exchange-traded funds that hold real Bitcoin). History shows the speed is possible. It does not show it will repeat.
What is holding Bitcoin back right now
- ETF outflows. Spot Bitcoin ETFs in the US have been seeing money leave rather than arrive (Bitcoin World, Crypto.news). These funds were among the biggest buyers on the way up, so their selling weighs on the price.
- Forced selling by leveraged traders. In the drop to $62,000, billions of dollars of borrowed (leveraged) positions were closed automatically, which pushed the price down faster. We explained how these chain reactions work in our Black Weekend crash post.
- A cautious mood. Some analysts now talk about a "bear market", and prediction markets have priced $100,000 as unlikely in the near term, according to Cointelegraph.
What would need to change for $100,000
Think of it as a checklist. The more of these turn positive, the stronger the case:
- Money flowing back into Bitcoin ETFs for several weeks in a row, not just one good day.
- Bitcoin reclaiming $67,000 to $70,000 and holding it, turning old selling zones into floors.
- Calmer global markets: softer US interest-rate expectations and a weaker US dollar have usually helped Bitcoin.
- Funding rates staying normal. When traders pile into leveraged longs, funding (the fee longs pay shorts on perpetual futures) jumps and the move becomes fragile. A slow, steady climb is healthier than a frenzy.
- No new shock from a big crypto company, exchange or regulator.
If only one or two of these happen, a bounce toward the $70,000s or $80,000s is more realistic than a straight run to $100,000.
How to watch it on a chart
You don't need to guess. A few things show the trend clearly:
- The Magic Line (Tradnexa's trend line, ATR 18 × 4 for crypto) turns green when the price closes above it on the chart. On the daily chart, a green Magic Line above $70,000 would show a real change in trend.
- Higher highs and higher lows: each dip stopping above the last one is the classic sign of a recovery.
- Volume on up days larger than on down days.
- Options bias: the BTC options reading on Tradnexa charts shows whether traders are leaning bullish or bearish on Bitcoin options.
You can follow all of this live on Tradnexa charts, and see support and resistance zones on our free Bitcoin levels today page.
So, can it cross $1 lakh again?
Yes, it can. Bitcoin has done a 50% move from this exact price area in under two months before. But not by itself: it would need money returning to Bitcoin ETFs, the $67,000 to $70,000 zone won back, and a calmer global market. Right now, most of those boxes are not ticked, and analysts are split, with some still pointing to $60,000 first.
The honest answer is: watch the levels, watch the flows, and don't bet the house on a headline. Crypto can move 50% in either direction, and leverage makes both directions faster.
FAQ
What is Bitcoin's all-time high?
Bitcoin's record is about $126,000, set in October 2025. At around $65,000, it is roughly 48% below that peak.
When was Bitcoin last above $100,000?
Bitcoin last traded above $100,000 in November 2025 and has stayed below it for all of 2026 so far.
How much does Bitcoin need to rise to reach $100,000?
From about $65,000, Bitcoin needs to rise roughly 54% to reach $100,000. In October 2024 it made a similar move, from the mid $60,000s to above $100,000, in about seven weeks.
What is pushing Bitcoin down in November 2026?
Money leaving US spot Bitcoin ETFs, forced selling of leveraged positions during the drop to $62,000, and a more cautious global mood.
Is this a recommendation to buy Bitcoin?
No. This post explains the levels, history and money flows so you can read the chart yourself. Crypto is very volatile and you can lose a large part of your money, especially with leverage.
Sources
- Crypto.news: Bitcoin price prediction this week: Will BTC crash to $60K or reclaim $70K? (Nov 2026)
- Bitcoin.com News: Bitcoin price sheds 14% in a week as market recovery faces fresh test (Nov 2026)
- Cryptonews: Bitcoin slides to $62,000 as analysts eye $60,000 as the line in the sand (Nov 2026)
- Bitcoin World: Bitcoin holds below $65,000 as ETF outflows weigh on recovery (Nov 2026)
- CoinDesk: Bitcoin knocks on $78,000 in V-shaped comeback as midterm uncertainty fades (4 Nov 2026)
- Cointelegraph: Bitcoin prediction markets say $100K BTC price out of reach for now
- Bitcoin.com News: Bitcoin price won't break $100K by end of 2026, analysts say why
- The Motley Fool: Should you buy Bitcoin while it's under $125,000? (15 Jan 2026)
For education only. Not investment advice. Tradnexa is not a SEBI-registered investment adviser or research analyst. Trading in crypto, futures and options carries a high risk of loss; past moves don't predict future ones. Read our risk disclaimer.